
Figure 8.
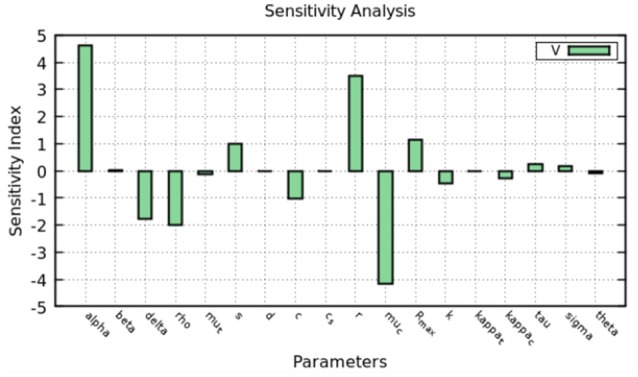
Sensitivity analysis of the model at 2 days. The figure shows how much a perturbation of the parameters influence the viral load (V).
Official websites use .gov
A
.gov website belongs to an official
government organization in the United States.
Secure .gov websites use HTTPS
A lock (
) or https:// means you've safely
connected to the .gov website. Share sensitive
information only on official, secure websites.
Sensitivity analysis of the model at 2 days. The figure shows how much a perturbation of the parameters influence the viral load (V).