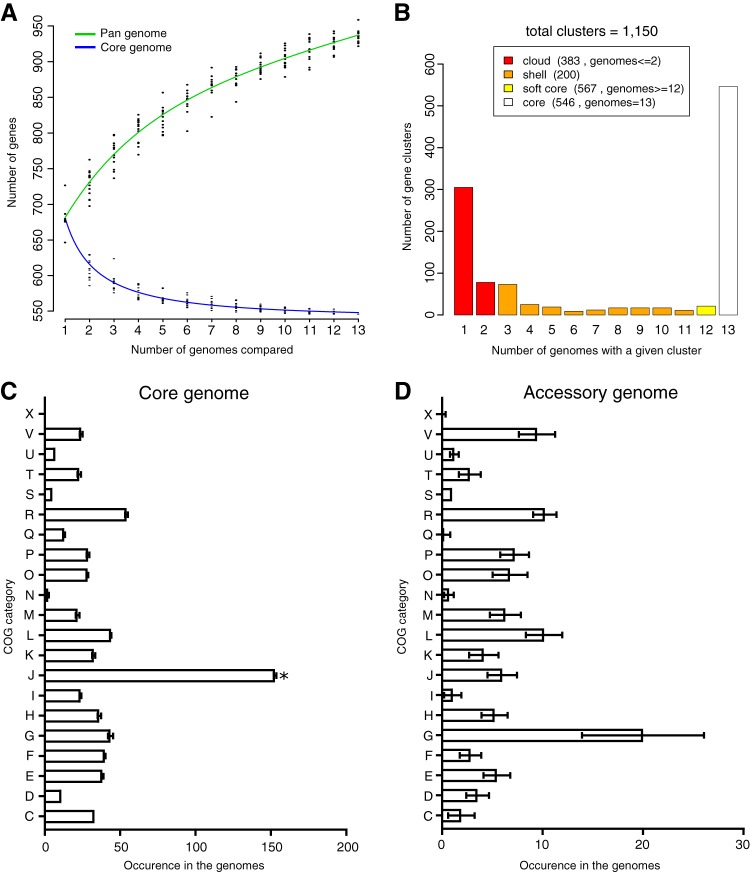
FIG 2 .
Pangenomes and core genomes of 13 M. florum strains. (A) Gene number estimation curves for the core genomes (blue, bottom curve) and pangenomes (green, top curve) were generated by the methods of Willenbrock et al. (60) and Tettelin et al. (61), respectively. (B) Prevalence of the different protein clusters across 13 strains. (C, D) Average number of protein groups in COG categories found in the core (C) and accessory (D) genomes of each strain. The COG categories are as follows: C, energy production and conversion; D, cell cycle control, cell division, and chromosome partitioning; E, amino acid transport and metabolism; F, nucleotide transport and metabolism; G, carbohydrate transport and metabolism; H, coenzyme transport and metabolism; I, lipid transport and metabolism; J, translation, ribosomal structure, and biogenesis; K, transcription; L, replication, recombination, and repair; M, cell wall/membrane/envelope biogenesis; N, cell motility; O, posttranslational modification, protein turnover, chaperones; P, inorganic ion transport and metabolism; Q, secondary metabolite biosynthesis, transport, and catabolism; R, general function prediction only; S, function unknown; T, signal transduction mechanisms; U, intracellular trafficking, secretion, and vesicular transport; V, defense mechanisms; X, mobilome (prophages, transposons).

