Figure 3.
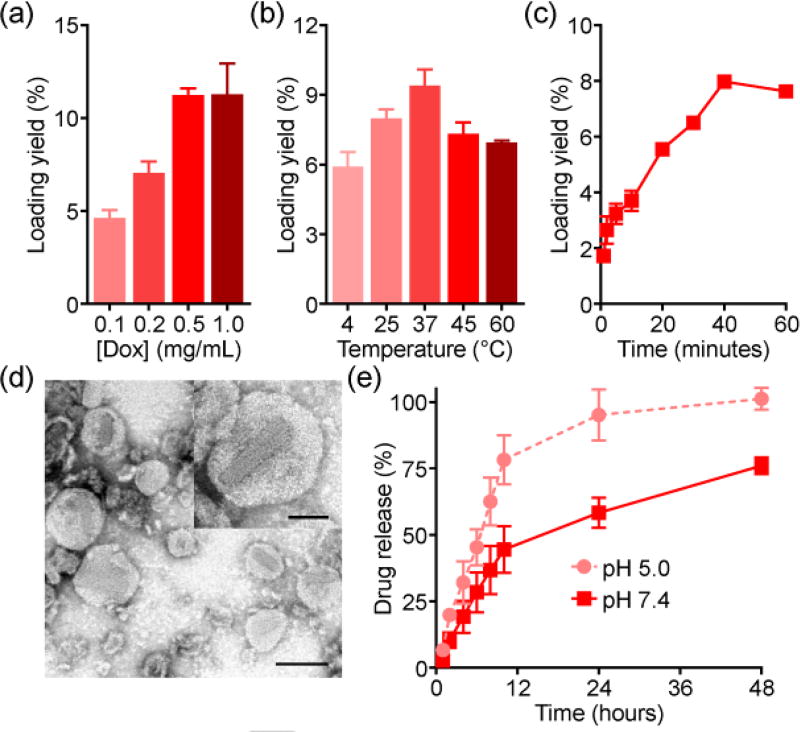
Dox loading into RBC vesicles. a) Loading yield at different drug inputs (n = 3; mean ± SD). b) Loading yield at different temperatures (n = 3; mean ± SD). c) Loading yield over time (n = 3; mean ± SD). d) Transmission electron microscopy images of Dox-RBC after negative staining with uranyl acetate (scale bar = 100 nm). Inset depicts a single Dox-RBC particle (scale bar = 50 nm). e) Dox release at pH 5.0 or pH 7.4 (n = 3; mean ± SD).

