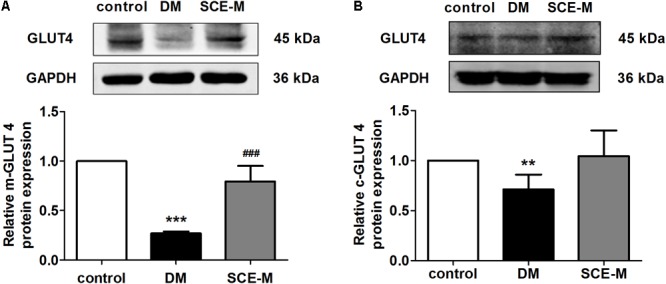
FIGURE 1.

Effect of SCE on GLUT4 expression in skeletal muscle of diabetic rats. Relative protein levels of glucose transporter isoform 4 (GLUT4) in the (A) plasma membrane and (B) cytoplasm measured by western blot analysis in the control, diabetes mellitus (DM) and middle-dose of SCE-M groups (n = 4). ∗∗P < 0.01, ∗∗∗P < 0.001 vs. control group and ###P < 0.001 vs. DM group; mean ± SD.
