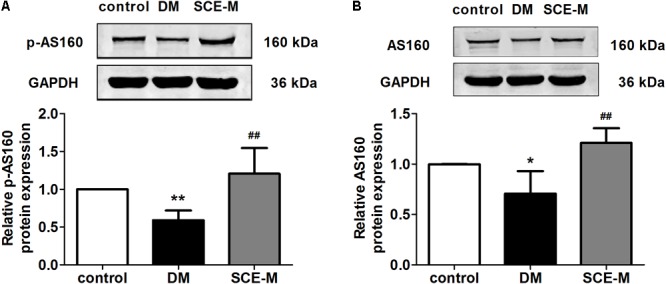
FIGURE 2.

Effect of SCE on AS160 expression in skeletal muscle of diabetic rats. (A) Relative protein levels of the phosphorylated form of AS160 (phosphorylated at Thr642). (B) Total protein levels of AS160 in the control, DM and SCE-M groups (n = 4). ∗P < 0.05, ∗∗P < 0.01 vs. control group and ##P < 0.01 vs. DM group; mean ± SD.
