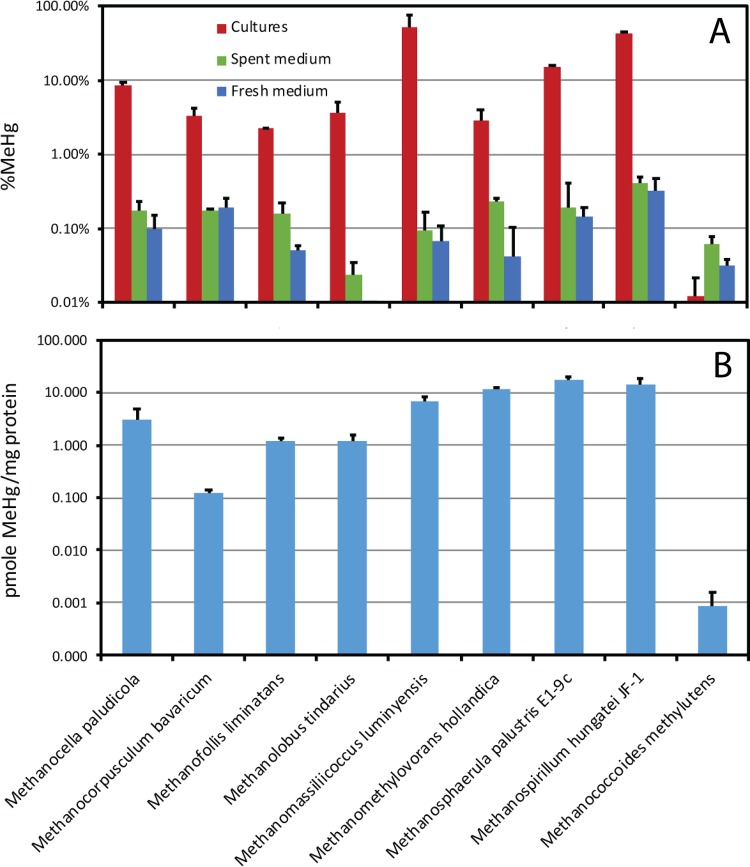
FIG 1 .
Maximal conversion of inorganic Hg to MeHg during batch culture growth by each hgcAB+ methanogen tested, expressed two ways. (Top) MeHg as a percentage of the total measured Hg in the culture medium (both unfiltered) at the end of log growth. Green and blue bars show noncellular control values. (Bottom) MeHg normalized to protein measured at the end of the log growth phase. Note the log scales. Bars are averages of triplicate separate cultures or controls. Methylation was measured from a 1 nM 201Hg(II) spike. Error bars are based on the standard deviation of MeHg only. M. luminyensis data are from reference 2.

