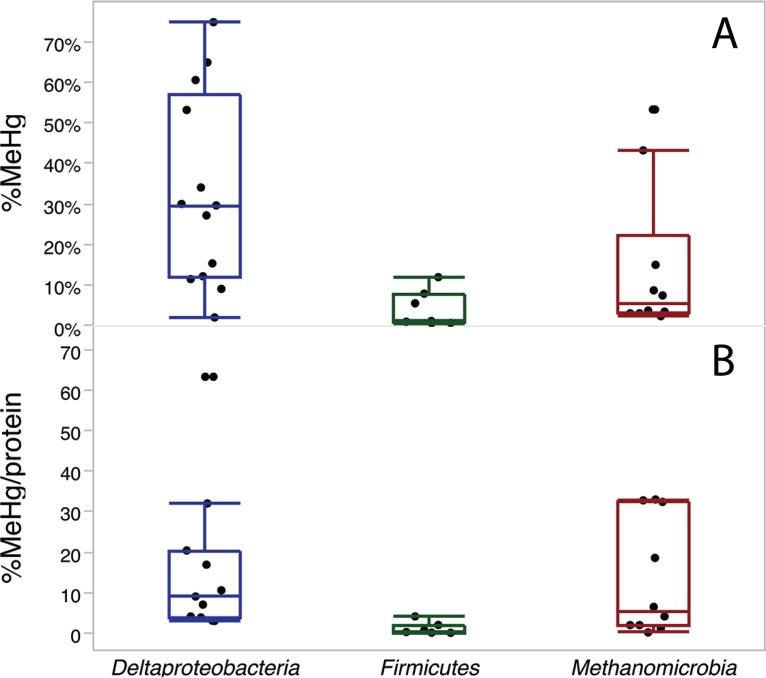
FIG 2 .
Comparison of maximal MeHg production among the three major clades of Hg-methylating bacteria. (Top) Maximal conversion of inorganic Hg to MeHg by 13 Deltaproteobacteria, 7 Firmicutes, and 10 Methanomicrobia species. (Bottom) MeHg production normalized to both the measured Hg and protein concentrations at the end of methylation assays, for the same organisms and assays, as (MeHg/Hg)/(mg of protein/liter). Hg spike levels ranged from 1 to 50 nM. Data combine assays done over the course of batch culture growth in this study, in the study described in reference 4, and during 3-h washed-cell assays (21). In these bar-and-whisker plots, the average value for each species is represented by a dot; the centerline, top, and bottom of each bar are the median and upper and lower quartiles, respectively, across all species; and the whiskers are drawn to the furthest data point within 1.5× the quartile value (thus excluding outliers).

