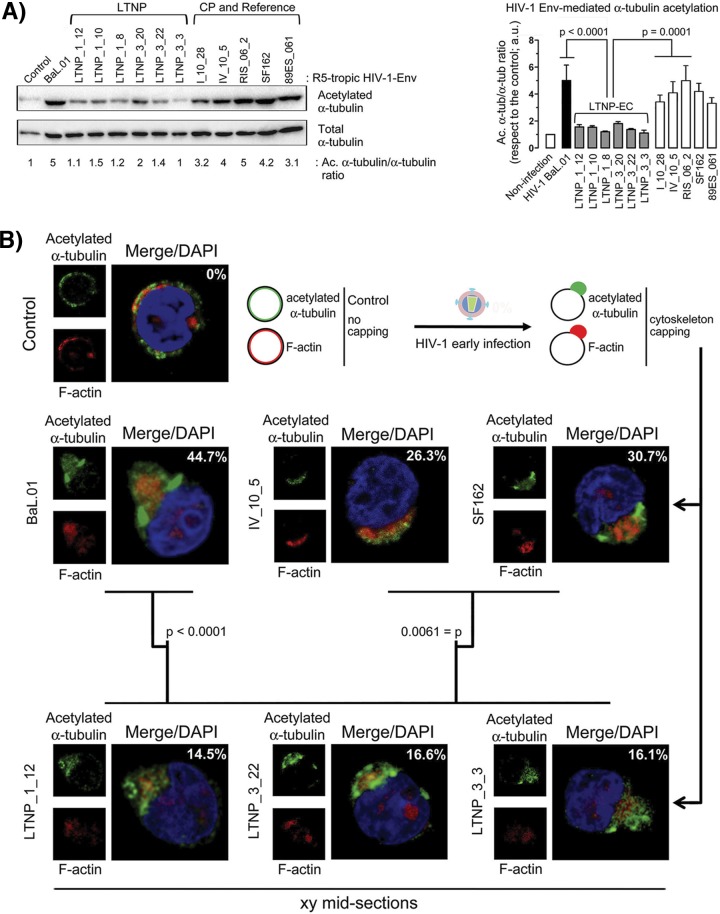
FIG 5 .
Effect of HIV-1 Env on α-tubulin acetylation and F-actin and acetylated α-tubulin reorganization, capping, and pseudopodium formation. (A, left panel) Quantitative Western blot analysis of LTNP-EC HIV-1 Env-induced α-tubulin acetylation in permissive cells compared with Envs from reference and chronic progressor (CP) patients’ viral strains, represented as acetylated α-tubulin in reference to total α-tubulin (Ac. α-tub/α-tub ratios). A representative experiment of six performed is shown. (Right panel) Histograms show the quantification of HIV-1 Env-mediated α-tubulin acetylation in permissive cells from six independent experiments carried out in triplicate. Data are means ± standard errors of the means (SEM). Acetylated α-tubulin/α-tubulin ratios are given in arbitrary light units (a.u.). (B) A series of fluorescent confocal images shows HIV-1 Env-induced redistribution of acetylated α-tubulin and actin cytoskeleton and pseudopodium formation in control, untreated, or HIV-1 Env early infected permissive cells. Merged images are shown with DAPI (4′,6-diamidino-2-phenylindole) labeling of the nucleus. A representative experiment of six performed is shown indicating the percentage of cells affected per 150 cells counted under any experimental condition. P values from Student’s t test are indicated. A scheme is presented showing the different cell morphologies and cytoskeleton profiles observed.

