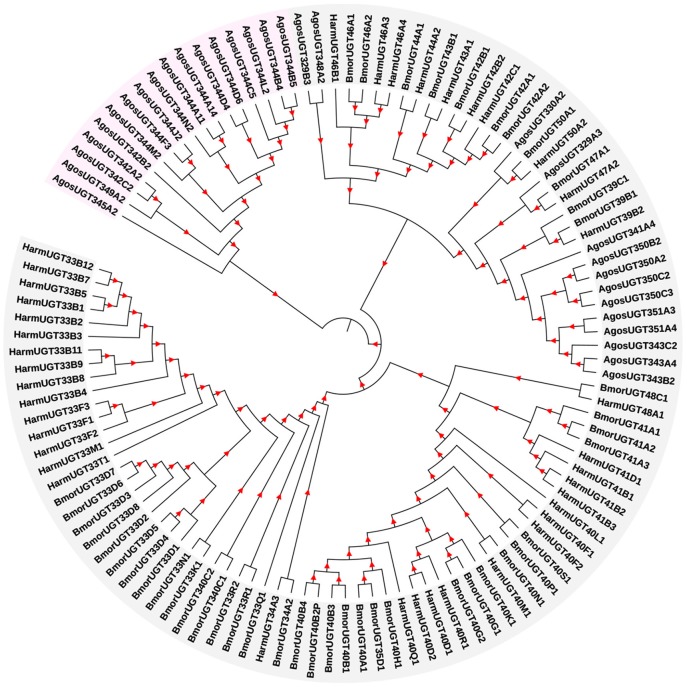
Figure 1.
Phylogenetic analysis of A. gossypii UGT genes with other orthologs. The phylogram was generated using the maximum likelihood method in MEGA 7, and bootstrap values were calculated based on 1,000 replicates with a cutoff of <50%. The sequences used for constructing the tree and their corresponding GenBank accession numbers are listed in Supplementary Data 1.

