
Figure 1.
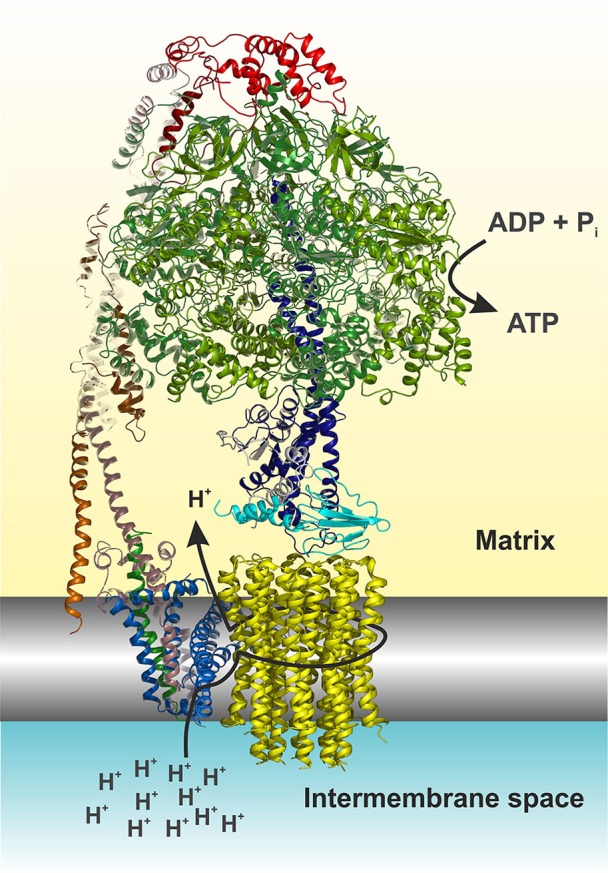
Cartoon representation of the yeast F1Fo ATP synthase. The view is horizontally to the membrane shown in grayscale. The structure was drawn according to (Hahn et al., 2016, PDB code 5FL7). For simplicity the structure is shown without subunits e, f, g, I, and a truncated subunit b. The figure was made in Pymol (The PyMOL Molecular Graphics System, Version 0.99, Schrödinger, LLC), using the following color code: α, forest; β, split pea; γ, density; δ, cyan; ε, white; OSCP, red; b (= 4 in yeast), dirty violet; d, orange; h, salmon; 8, green; a, blue; c-ring, yellow. The arrows indicate the path of protons (see also Figure 4) and nucleotide conversion. For details see text.