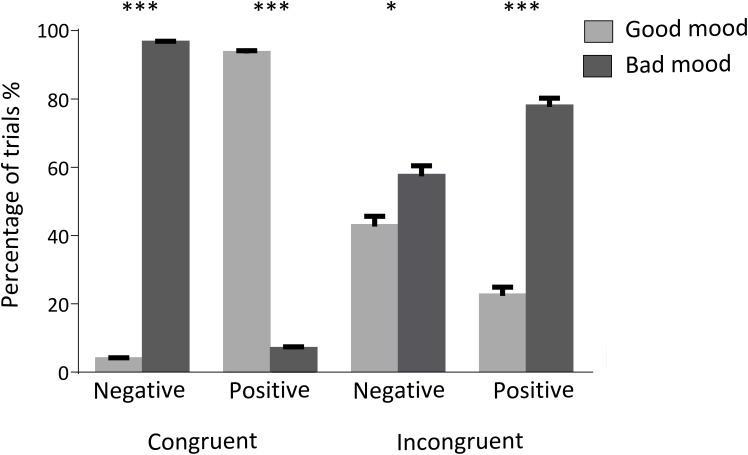
FIGURE 3.
Percentage of trials judged as good or bad mood. Bars indicates the mean and SEM of the percentage of trials judged as good or bad mood for each condition. ‘Negative’ and ‘Positive’ indicates the emoticon’s valence. ∗, ∗∗∗: statistically significant differences with p values < 0.05, or < 0.001, respectively.

