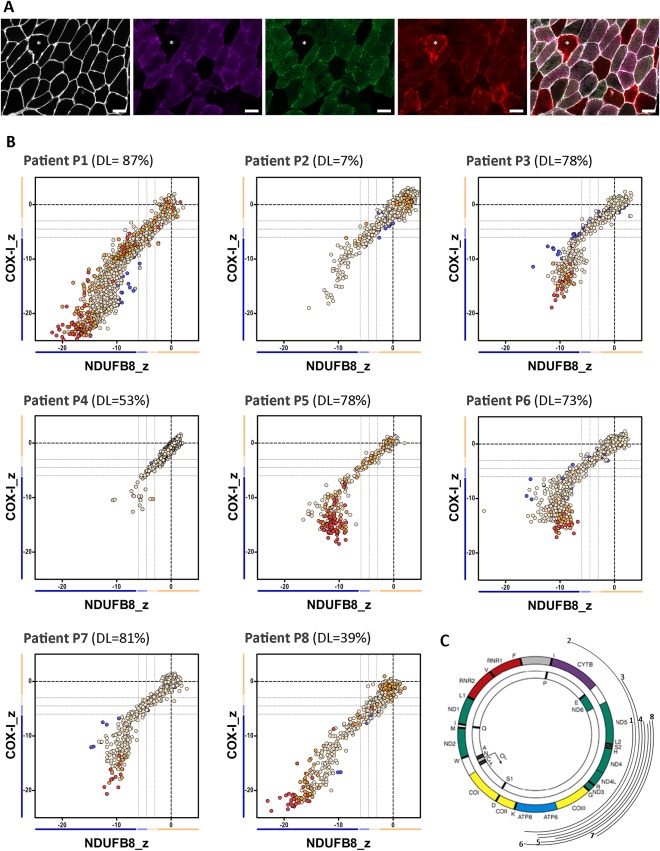
Figure 2.

The mitochondrial respiratory chain profile and genotype from patients with single, large‐scale mtDNA deletions grouped in class I, showing both complexes I and IV equally affected. (A) The quadruple immunofluorescence (white = laminin [750nm], purple = NDUFB8 [647nm], green = COX‐I [488nm], red = porin [546nm]) was performed on 10µm sections and highlights (asterisks) the presence of fibers with both complex I and IV affected; scale bars measure 50µm. (B) Graphs show complex I and IV expression profile from patients: P1 (n = 1,448 fibers analyzed), P2 (n = 1,261), P3 (n = 631), P4 (n = 1,228), P5 (n = 388), P6 (n = 853), P7 (n = 609), and P8 (n = 1,309). DL indicates the mtDNA deletion load (proportion of deleted over wild‐type mtDNA) determined in muscle homogenates. Each dot represents an individual muscle fiber color coded according to its mitochondrial mass (blue = very low, light blue = low, beige = normal, orange = high, red = very high). Thin black dashed lines indicate the standard deviation limits for the classification of fibers; lines next to x‐ and y‐axes indicate the levels of NDUFB8 and COX‐I, respectively (beige = normal, light beige = intermediate(+), light blue = intermediate(−), blue = negative). Bold dashed lines indicate the mean expression level of normal fibers. (C) Location and size of the mtDNA deletion from individual patients (inside arc = P1 to outside arc = P8).
