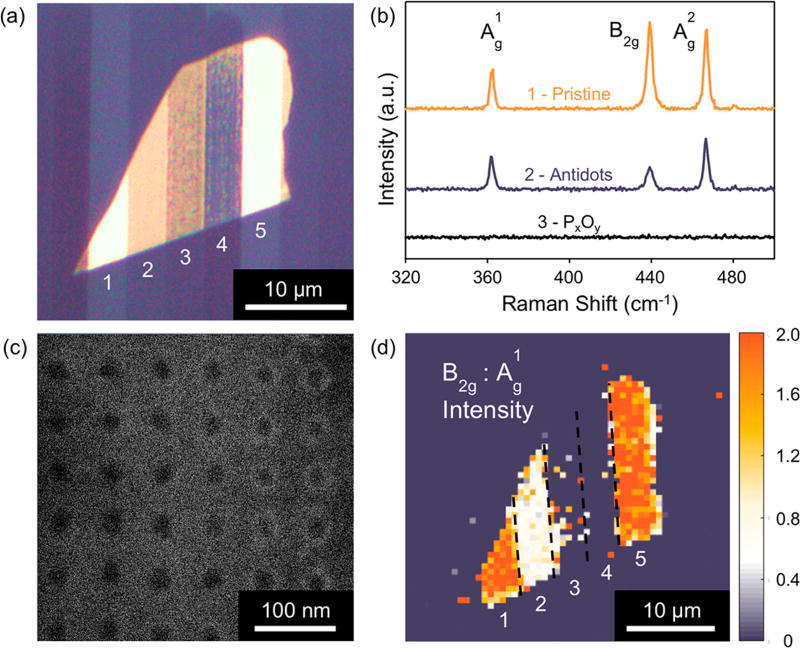
Figure 2.
Characterization of fabricated antidot arrays in few-layer BP. (a) Optical image of columnar regions with (1) pristine few-layer BP, (2) patterned antidots (SC = 60 nm and R = 23 nm), (3) PxOy, (4) bare SiO2/Si substrate, and (5) pristine few-layer BP. (b) Raman spectra of (1) pristine few-layer, (2) antidot, and (3) PxOy regions normalized to the peak of (1), showing suppression of the in-plane modes (B2g and ) in the antidot region. (c) SEM image of a square antidot array with SC = 65 nm and R = 13 nm. (d) intensity Raman map from the sample in (a). Note: SC is the average in-plane superlattice constant and R is the average antidot radius.

