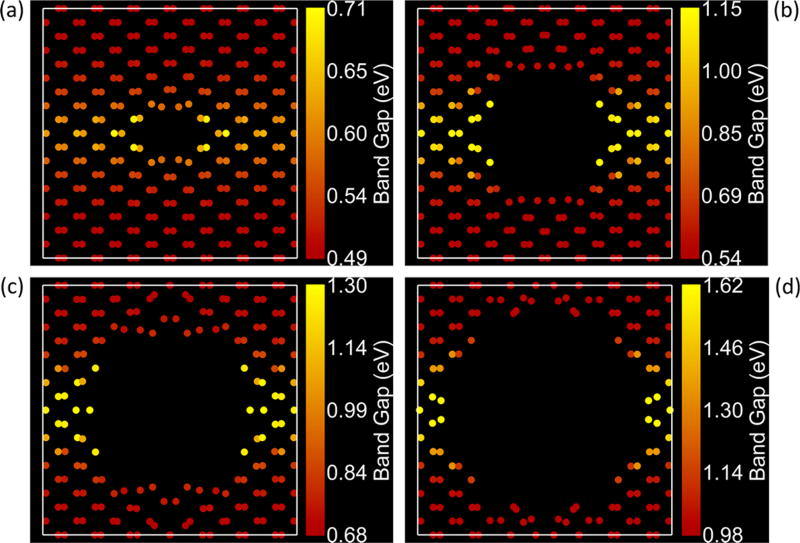
Figure 8.
Spatial distribution of the band gap for OC with SC = 3.02 nm. The radii (in nm) are (a) 0.45, (b) 0.90, (c) 1.15, and (d) 1.37. The local band gap is defined as the band gap observed in the PDOS plot on each atom of the structure. The largest band gap atoms are present in the zigzag nanoconstrictions, which is consistent with the strength of quantum confinement effects in phosphorene nanoribbons.20–23,25–29

