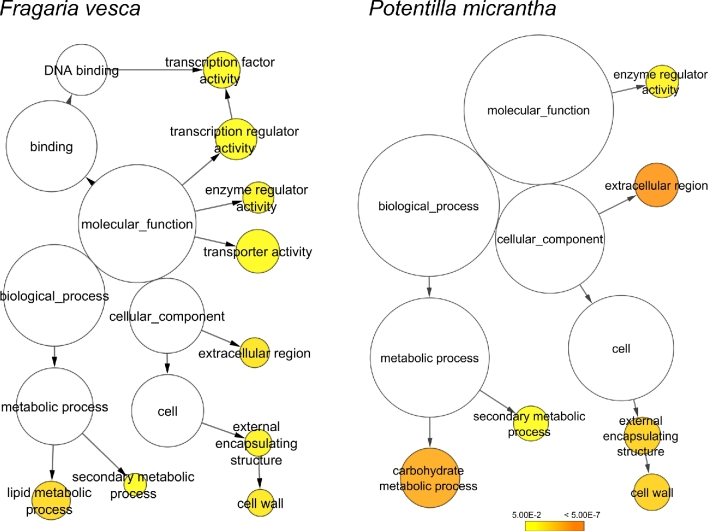
Figure 5:
Overrepresented GO-slim categories in Fragaria vesca and Potentilla micrantha differentially expressed gene sets. The circles are shaded based on significance level (yellow = FDR below 0.05), and the radius of each circle is proportional to the number of genes included in each GO-slim category.

