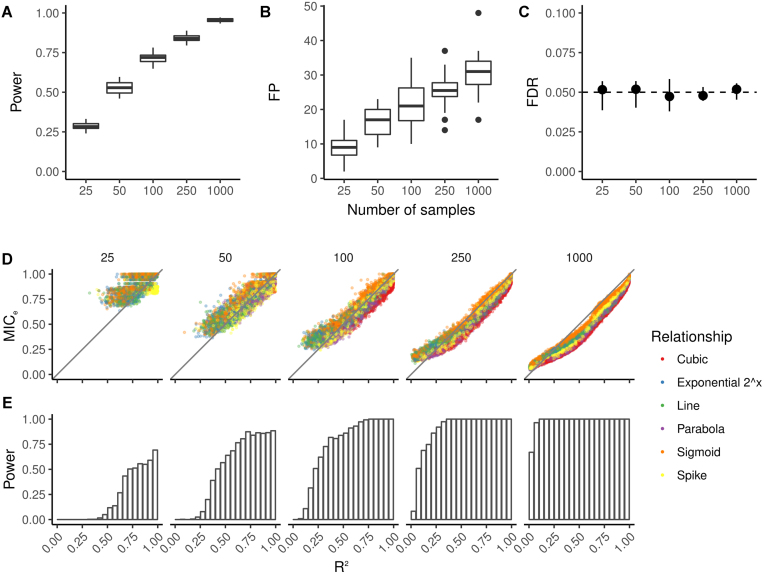
Figure 2:
Analysis on SD1 dataset at the 0.05 significance level. A) Statistical power, B) number of FPs, and C) FDR for varying number of samples n. Each range represents the results of the 20 replicates. D) MICe values and E) statistical power at different levels of R2, for increasing number of samples (from 25 to 1,000, plots from left to right). Only significant relationships, i.e., relationships with q < 0.05, are shown.

