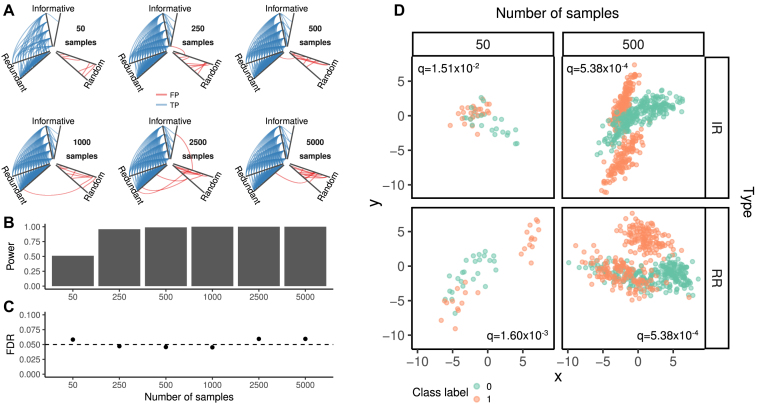
Figure 4:
Madelon dataset. A) Hive plots of the detected association for increasing number of samples. The variables are grouped as “informative” (5), “redundant” (15), and “random” (180). True positives (associations between nonindependent variables passing the significance test) are in blue; false positives (associations between independent variable passing the significance test) are in red. B) Power and C) false discovery rate as a function of the number of samples. D) Example of significant relationships between informative and redundant (IR) and redundant (RR) variables within the Madelon datasets with 50 and 500 samples.

