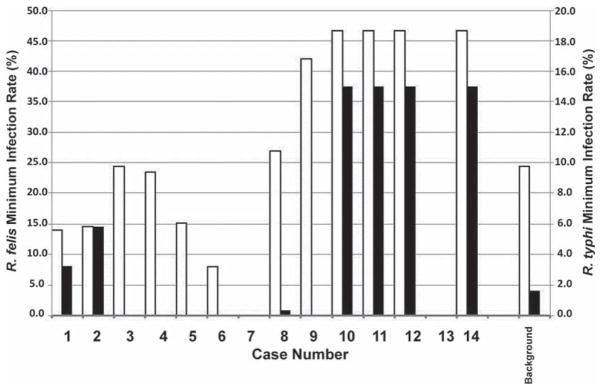
Fig. 3.
Minimum infection rates for R. typhi and R. felis in fleas collected within one mile of individual case households. Minimum infection rates were calculated as the ratio of the numbers of PCR positive flea DNA samples divided by total number of flea DNA samples tested. The background prevalence was calculated from all fleas collected more than 1 mile from any known case household. No animals were collected within 1 mile of cases 7 and 13.

