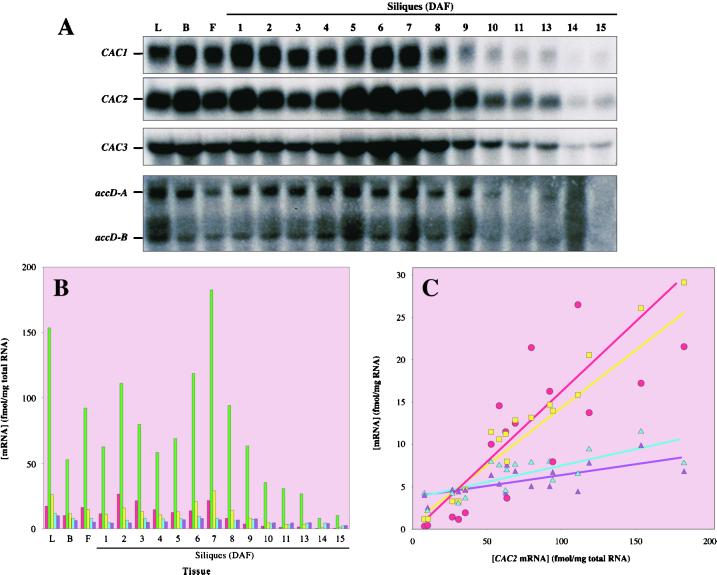
Figure 6.
Coordinate temporal changes in accumulation of mRNAs coding the heteromeric ACCase subunits. A, RNA blots were hybridized with CAC1-, CAC2-, CAC3-, and accD-specific 32P-labeled antisense RNA probes. RNA was isolated from young expanding leaves (L), flower buds (B), flowers (F), and developing siliques at the indicated DAF. B, The concentration of the CAC1, CAC2, CAC3, and accD mRNAs was determined by comparing the intensity of hybridization of each mRNA to the hybridization intensity obtained with RNA concentration standards, as described in “Materials and Methods.” The average values from three independent determinations are shown. The sd for each determination ranged between 10% and 15% of the indicated values. CAC1 (red), CAC2 (green), CAC3 (yellow), accD-A (blue), or accD-B (purple) mRNAs. C, For each of the tissues analyzed in A and B, the concentrations of the CAC1 (red), CAC3 (yellow), accD-A (blue), or accD-B (purple) mRNAs are plotted against the concentration of the CAC2 mRNA. Linear regression analyses indicate that there is a linear relationship between the concentrations of each of these mRNAs with correlation coefficients of greater than 0.85.

