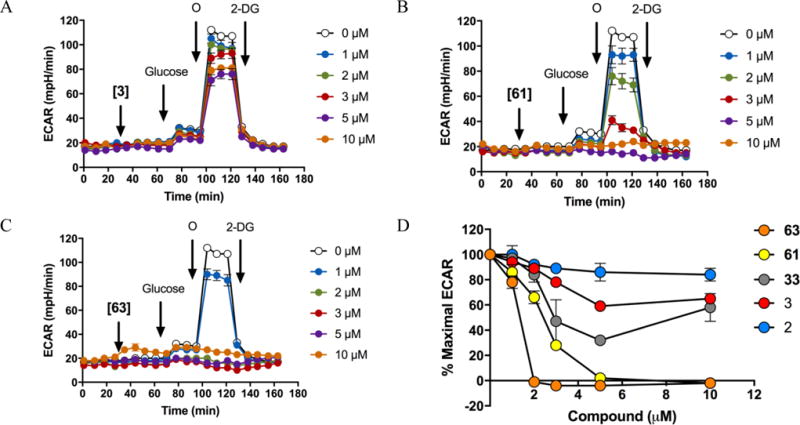
Figure 4.

Decrease in glycolytic flux caused by LDH inhibitors in A673 cells. The Glycolysis Stress Test was performed in A673 cells, The Extracellular acidification rate (ECAR) over time; cellular basal ECAR was measured, then compounds (A) GNE140, (B) 61 or (C) 63 were injected in a dose-response manner, after 40 min, subsequent injections of glucose (10 mM), oligomycin (O at 1μg/mL; reaching maximal glycolytic capacity), and 2-deoxyglucose (2-DG at 50 mM; inhibition of glycolysis) were made. (D) Quantification of the maximal ECAR (% from control of maximal ECAR minus ECAR with 2-DG) of increasing concentrations of the five LDH inhibitors.
