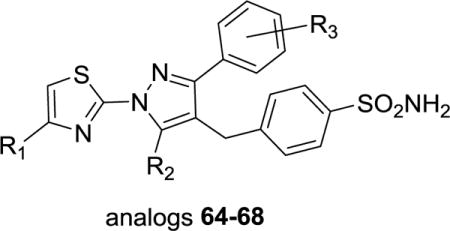
Table 3.
LDHA Inhibition of analogs 64–68a

| ||||
|---|---|---|---|---|
|
| ||||
| Analog | R1 | R2 | R3 | LDHA (w/EDTA) IC50 ± SD (μM) |
| 64 | CONH2 | OH | 3-Ph | 27.7 ± 1.9 |
| 65 | COOEt | CF3 | 3-Ph | >57 |
| 66 | CH2OH | CF3 | H | 25.5 ± 6.2b |
| 67 | tetrazole | OH | 3-Ph | >57 |
| 68 | CH(OH)CF3 | H | H | >57 |
IC50 values represent the half maximal (50%) inhibitory concentration as determined in the HTS assay (n ≥ 3) using a 22-dose response in 1536-well format.
Max. response was less than 50% and thus IC50 values should be considered as lower confidence.
