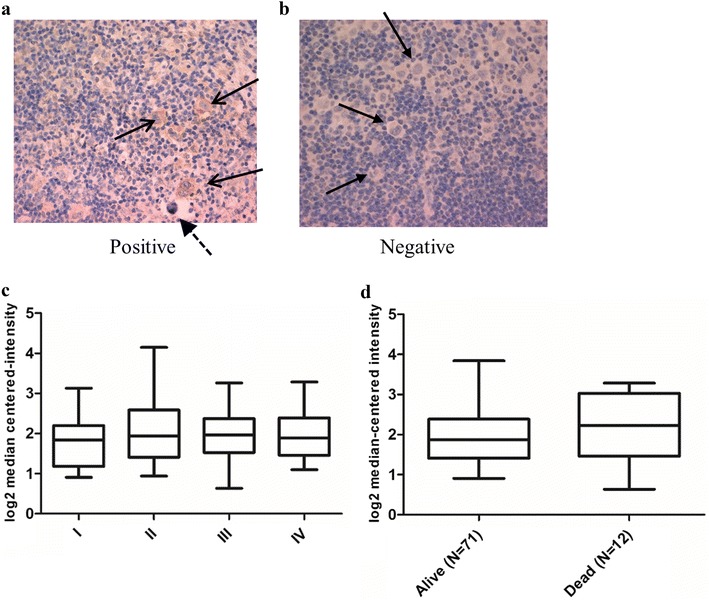
Fig. 1.

PRL-3 was expressed in cHL biopsies. a PRL-3 expression in HRS cells (arrows) and not in the surrounding cells measured by IHC. Dashed arrow indicates a so-called “mummy” cell. b IHC with negative PRL-3 expression in HRS cells (indicated by arrows). c, d PRL-3 expression did not correlate to clinical endpoints like stage (c) or survival (d). Analysis of gene expression data from Steidl et al. [22]. Line in the middle of the box represent median and boxes represent 25–75 percentiles of log2 median-centered intensity of PRL-3 expression. Whiskers represent minimum and maximum values
(Data adapted from http://www.oncomine.org)
