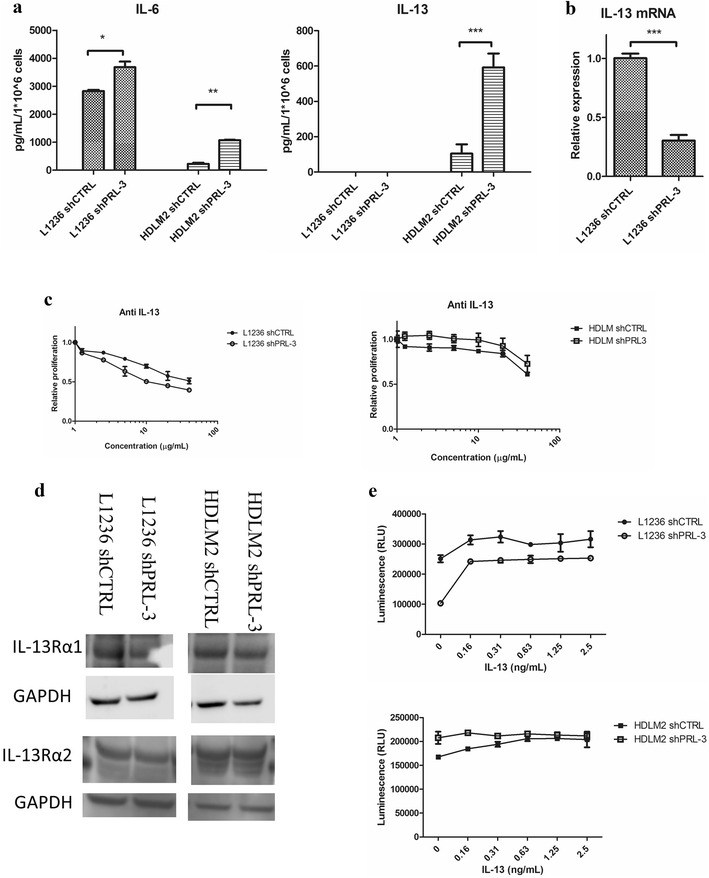
Fig. 5.

PRL-3 regulated cytokine production in cHL cell lines. a IL-6 and IL-13 secretion and b IL-13 mRNA expression. Bars represent secreted cytokine detected by ELISA or IL-13 expression measured by qRT-PCR. Figure shows one representative of three independent experiments. Error bars represent + 1 SD of duplicates. *p < 0.05. **p < 0.01. ***p < 0.001. c Neutralizing antibody against IL-13 for 48 h reduced proliferation as measured by CellTiter-Glo® assay. Error bars represent ± 1 SD of triplicates. Figure shows one representative out of three independent experiments. c Western blotting of IL-13 receptor subunits alpha 1 and alpha 2. d Proliferation after stimulation with IL-13 for 48 h, as measured by CellTiter-Glo® assay. Error bars represent ± 1 SD of triplicates. Figure shows one representative of three independent experiments
