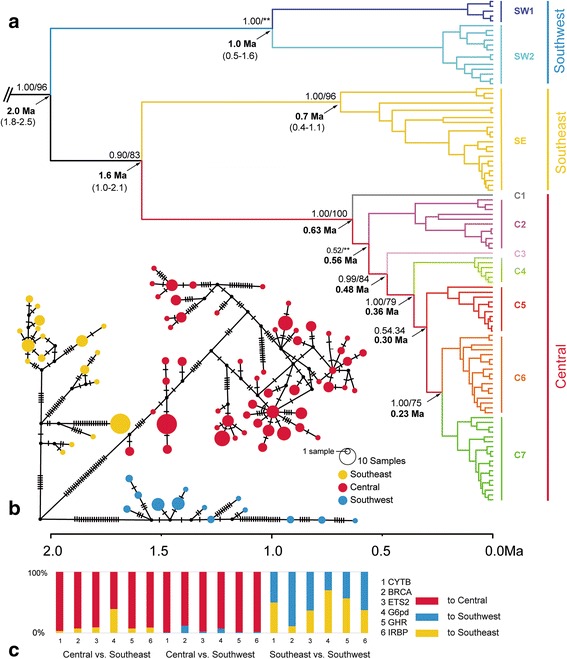
Fig. 2.

a Phylogenetic tree and divergence time estimation based on BEAST analysis of the cytb haplotypes of E. melanogaster. The numbers beside the nodes are posterior probabilities and bootstrap, and those below the nodes are divergence times estimated by BEAST (Ma, 95% HPD in brackets). b Median-joining network based on cytb with node sizes proportional to the frequencies of haplotypes. The number of hatch marks between haplotypes is proportional to the number of mutational changes. Dots represent undetected haplotypes. c Gene flow between maternal clades as estimated by MIGRATE (represented in %)
