
Fig. 4.
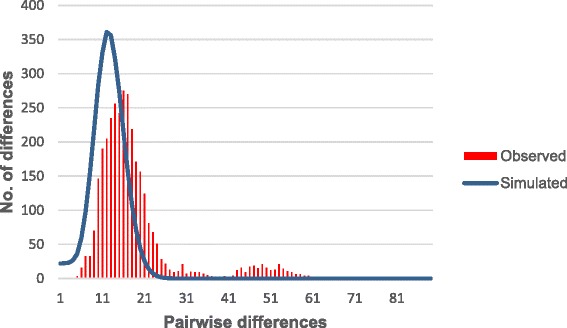
Mismatch distribution of pairwise number of differences in P. inui- like sub-clade A. The red bars represent the observed frequencies and the blue line represents the expected curve for a population that has undergone a demographic expansion
Official websites use .gov
A
.gov website belongs to an official
government organization in the United States.
Secure .gov websites use HTTPS
A lock (
) or https:// means you've safely
connected to the .gov website. Share sensitive
information only on official, secure websites.
Mismatch distribution of pairwise number of differences in P. inui- like sub-clade A. The red bars represent the observed frequencies and the blue line represents the expected curve for a population that has undergone a demographic expansion