
Fig. 4.
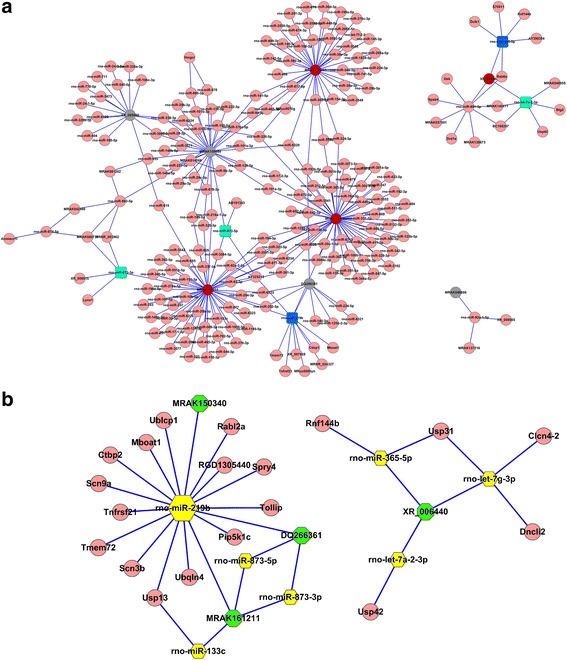
ceRNA analyses indicated the potential lncRNA/miRNA/mRNA interactions. a The potential binding target miRNAs of the verified lncRNAs. The red nodes mean down-regulated lncRNAs, the gray nodes mean up-regulated lncRNAs, the blue squares mean down-regulated miRNAs we are interested in, the green squares mean up-regulated miRNA we are interested in, and the pink nodes mean the other miRNAs and mRNAs. b The lncRNA/miRNA/mRNA networks that we are interested in are displayed. The green nodes represent lncRNAs, the yellow pentagons represent miRNAs and the pink nodes represent mRNAs we forecasted