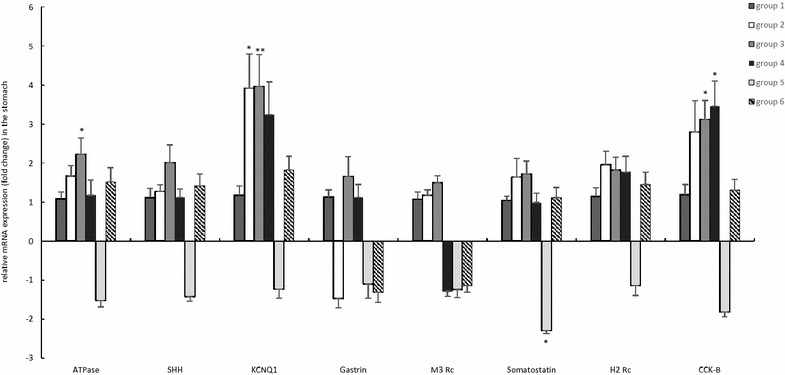
Figure 4.

General overview of relative fold changes of altered markers for gastric acid secretion in the bambermycin-supplemented and non-supplemented groups. The data are presented as fold changes in gene expression normalized to 3 reference genes and relative to control groups 1 and 4 (i.e. group 2–4 relative to group 1 and group 5–6 relative to group 4) which are considered as 1. The fold changes are shown as means with the standard error of the mean. Statistical differences were calculated using the non-parametric Kruskal–Wallis H test SPSS statistics 24®. *Significant differences with the control group (P < 0.05), **significant differences with the control group (P < 0.005). Group 1 = H. suis-negative control group without bambermycin supplementation; group 2 = 32 ppm bambermycin supplemented, non-H. suis infected group; group 3 = 64 ppm bambermycin supplemented, non-H. suis infected group; group 4 = H. suis-positive control group without bambermycin supplementation; group 5 = 32 ppm bambermycin supplemented, H. suis infected group; group 6 = 64 ppm bambermycin supplemented, H. suis infected group.
