Fig. 3.

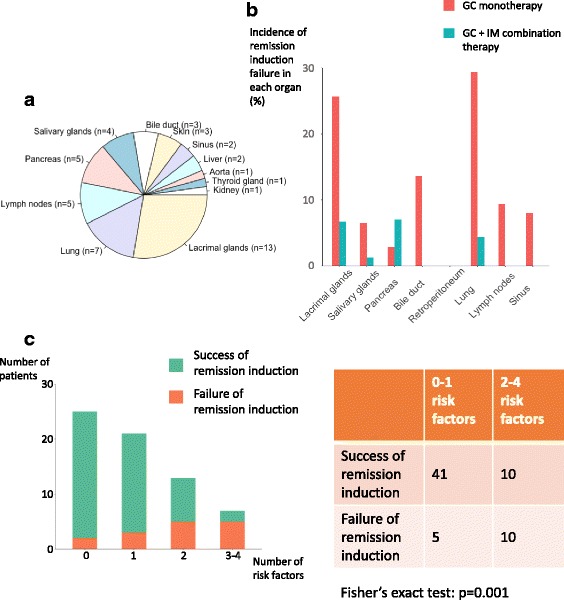
Organs that failed of remission induction. a Distribution of the organs that failed of remission induction. b Incidence of remission induction failure in each organ. The incidence was calculated as number of remission induction failures occurred in each organ/total number of patients with that particular organ involvement. c Treatment outcomes in the patients treated with glucocorticoid (GC) monotherapy, grouped according to the number of risk factors they had. Risk factors included eosinophilia, baseline responder index (RI) in the highest quartile, ≥ 5 organs involved and dacryoadenitis. IM, immunosuppressive agents
