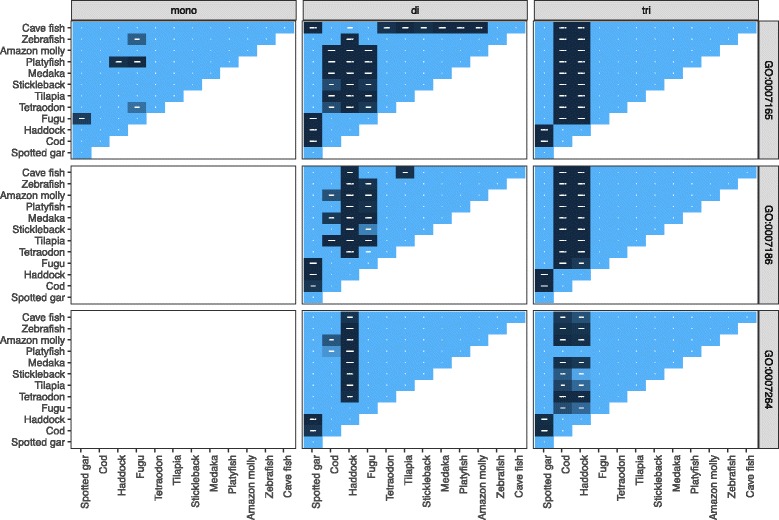
Fig. 5.

Pairwise Fisher’s exact test for some gene ontology groups and for some unit sizes. See Additional file 2: Figure S1 for the entire figure with 74 GO groups and unit sizes 1–10 bp, and Additional file 1: Table S4 for the GO groups where haddock and cod differ significantly from the other species. Shown here are GO:0007165 (signal transduction), GO:0007186 (G-protein coupled receptor signaling pathway) and GO:0007264 (small GTPase mediated signal transduction) for tandem repeats in 1–3 bp unit sizes. In the white panels and the white and light blue areas there are no significant differences, but in the dark blue areas there are significant differences between two species. For GO:0007165 and GO:0007186 there is a significant difference (P < 0.05) between cod and haddock and the other species, but not between cod and haddock, nor between cod and cave fish. For GO:0007264, this pattern is less apparent
