
Fig. 2.
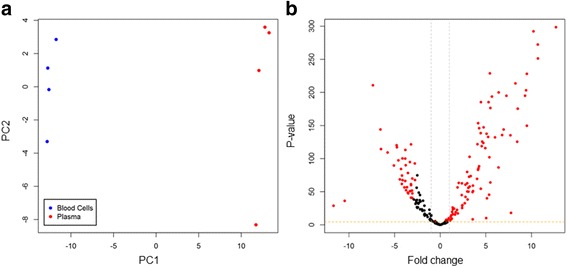
Small-RNA sequencing results. a PCA plot showing the first two principle components using transformed normalised data. b Volcano plot of fold-change (miRNA levels in blood plasma relative to cells) versus statistical significance (P-values), using transformed normalised data. MiRNAs with fold-change > 2 and FDR < 0.05 are highlighted in red. Grey dotted lines indicate two-fold difference thresholds. The orange dotted line indicates P = 0.05. Paired blood plasma and cell samples from four animals were analysed