
Fig. 4.
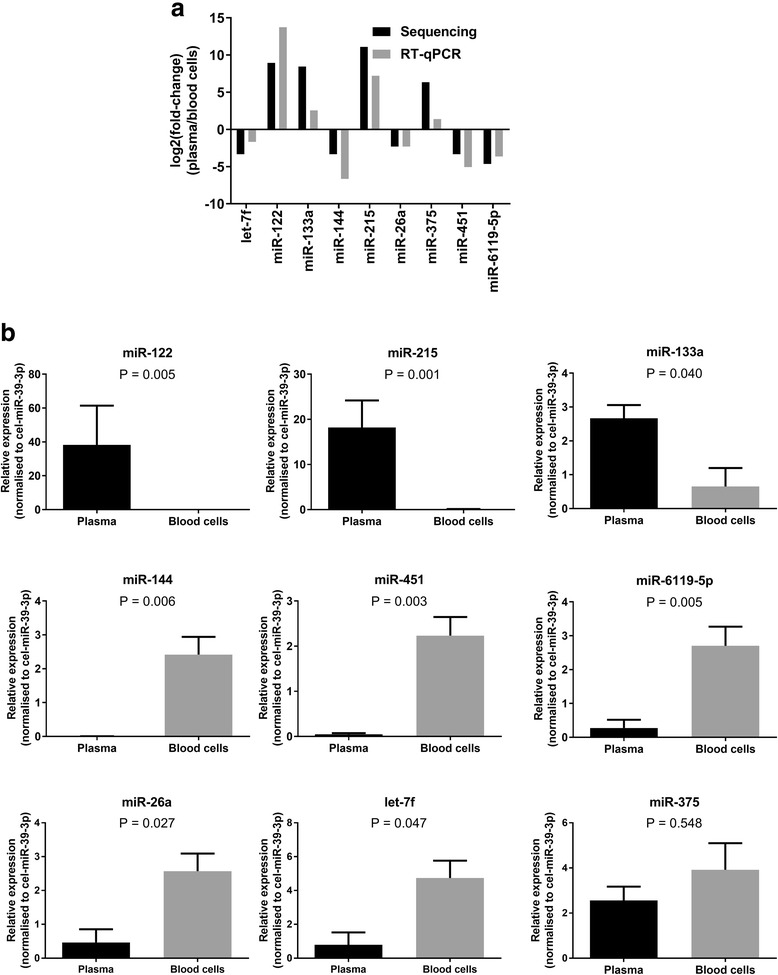
Validation of sequencing results. a Comparison of the fold-changes in miRNA levels in blood plasma relative to cells obtained using sequencing and RT-qPCR. b Relative expression (mean ± SEM, calculated from a standard curve) of selected miRNAs in paired blood plasma and cell samples from six cows. All expression levels were normalised to cel-miR-39-3p