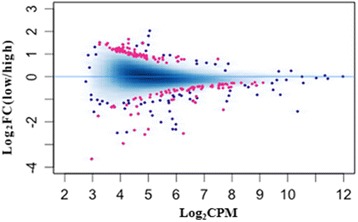
Fig. 1.

Differentially methylated regions (DMRs) between high-and sub-fertility striped bass sperm samples.The methylation analysis plot shows in red the DMRs obtained with a false discovery rate of < 0.1. The blue dots represent the methylated regions without difference between high-and sub-fertility groups. “FC” indicates fold-change and “CPM” indicates counts per million
