
Fig. 4.
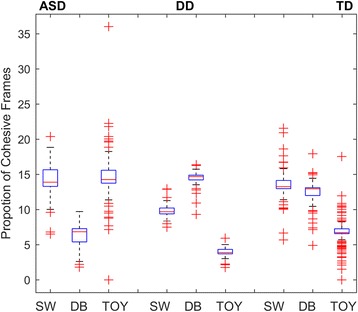
Box plots illustrating proportion of HCTFs in Dyadic Bid (DB), Sandwich (SW), and Animated Toy (TOY) conditions in within-group model. For ASD: DB<SW<TOY; for DD: TOY<SW<DB; and for TD: TOY<DB<SW. All effects p < .001
Official websites use .gov
A
.gov website belongs to an official
government organization in the United States.
Secure .gov websites use HTTPS
A lock (
) or https:// means you've safely
connected to the .gov website. Share sensitive
information only on official, secure websites.
Box plots illustrating proportion of HCTFs in Dyadic Bid (DB), Sandwich (SW), and Animated Toy (TOY) conditions in within-group model. For ASD: DB<SW<TOY; for DD: TOY<SW<DB; and for TD: TOY<DB<SW. All effects p < .001