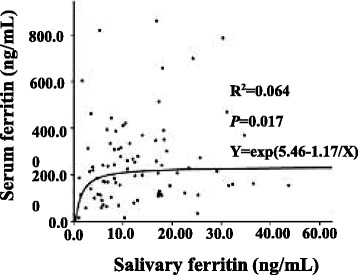
Fig. 3.

Curve correlations between serum ferritin concentrations and salivary ferritin levels. We used salivary ferritin levels as X, and serum ferritin levels as Y. Dots of the graph represent the detected concentration of ferritin. Lines of the graph represent the fitted curves. The correlation was observed between them (R2 = 0.064, P = 0.017). The equation is presented in Fig. 3 (Y = exp. (5.46–1.17/X))
