
Fig. 4.
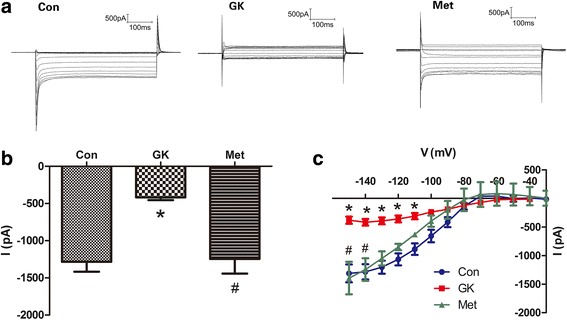
SK current recordings in atrial myocytes from control, GK and metformin-treated GK rats. a Representative tracings of SK currents. b Mean SK current intensity at − 140 mV. c Current-voltage relation of SK currents at voltages ranging from − 150 to − 20 mV. Results are mean ± SEM (n = 11-12 cells from three rats in each group); * represents P < 0.05 vs Con; # represents P < 0.05 vs GK