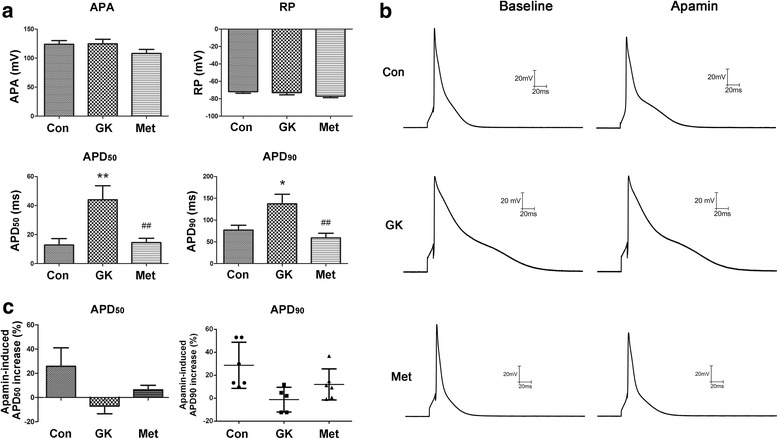
Fig. 5.

Action potential recordings in atrial myocytes from control, GK and metformin-treated GK rats. a Representative action potential parameters (APA, RP, APD50 and APD90) in freshly isolated atrial myocytes before exposure to apamin. b Action potential before and after exposure to apamin (100 pM for 15 min). c Changes in APD50 and APD90 after exposure to apamin. Non-normal distributed data were represented as median with interquartile range (n = 11-12 cells from three rats in each group); * represents P < 0.05 vs Con; ** represents P < 0.01 vs Con; # # represents P < 0.01 vs GK
