
Fig. 3.
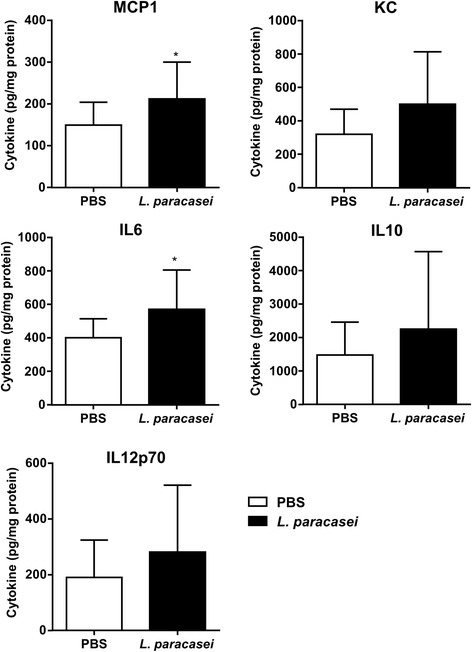
Effects of L. paracasei consumption on cytokine profiles relative to those of the control (PBS) group after 48 h of secondary meningococcal infection. Results are expressed as the mean ± SEM for each group (n = 20). Cytokines for which the differences between the two groups were significant are indicated by a star