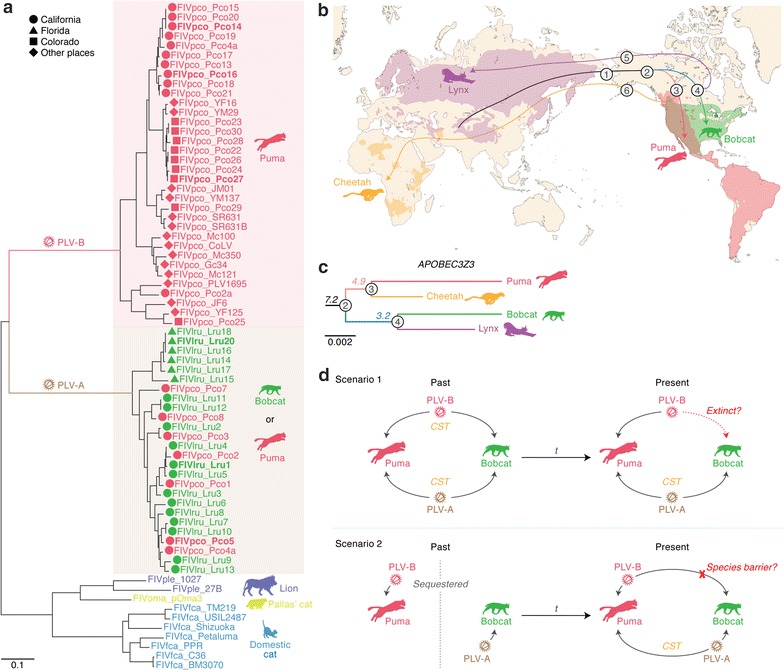
Fig. 1.

Evolutionary relationship of FIV vif and feline A3Z3. a Phylogenetic tree of FIV vif. This phylogenetic tree was constructed using the ML method and displays the evolutionary relationships among the FIV sequences used in this study. The scale bar indicates 0.1 nucleotide substitutions per site. The bootstrap values are indicated on each node as follows: *, > 50 and **, > 80. The FIV vif genes used in this study are indicated in bold. The PLV-A and PLV-B sampling locations are available from previous studies [17, 19, 59] and are indicated by symbols. b, c Evolutionary history of felids in the puma and bobcat lineages. b The evolutionary events of the four felid species (puma, bobcat, cheetah and lynx) are summarized according to a previous report [23]. The numbers in circles indicate the events as follows: 1, migration of the common ancestor of the puma (Puma concolor) and bobcat (Lynx rufus) through the Bering Isthmus from Eurasia to the New World (ca. 8.0–8.5 Mya); 2, divergence into the two lineages (ca. 7.2 Mya); 3, divergence of the puma and cheetah (Acinonyx jubatus) (ca. 4.9 Mya); 4, divergence of the bobcat and lynx (Lynx lynx) (ca. 3.2 Mya); 5, migration of the lynx from the New World to Eurasia (ca. 1.2–1.6 Mya); and 6, migration of the cheetah from the New World to Eurasia (ca. 1.2–1.6 Mya). The current habitats of the puma (red), bobcat (green), cheetah (yellow) and lynx (purple) are indicated by each color and are referred from the IUCN Red List of Threatened Species website (http://www.iucnredlist.org/). c Phylogenetic tree of feline A3Z3. The bobcat and cheetah A3Z3 sequences, which were newly identified in this study, were aligned with those of the puma and lynx, and the tree was reconstructed using the ML method. The branch colors correspond to those of the lines in b, and the circled numbers on the nodes correspond to those in b. The numbers under nodes in italics indicate the age of divergence (Mya) estimated in a previous study [23]. The scale bar indicates 0.002 nucleotide substitutions per site. d Two possible scenarios leading to the inter-species PLV transmission between the puma and bobcat. Each scenario is explained in the main text. CST cross-species transmission; t time
