Fig. 4.

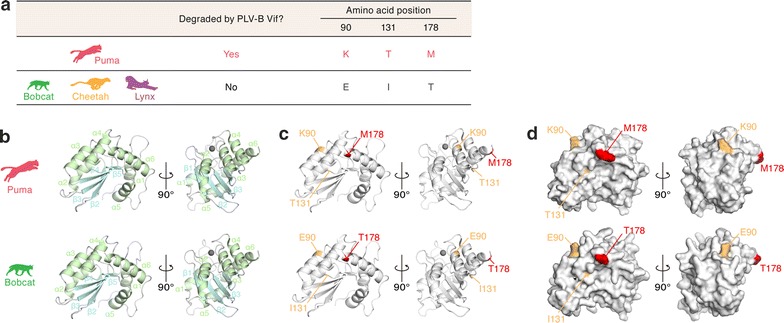
Structure modeling of puma and bobcat A3Z3. a Comparison of amino acid residues. The feline species used for the comparison (puma, bobcat, cheetah and lynx; left), the sensitivity of A3Z3 to PLV-B Vif (middle) and the amino acid residues at positions 90, 131 and 178 (right) are summarized. b–d Structural homology model of puma and bobcat A3Z3. Cartoon (b, c) and surface (d) models of the A3Z3 protein structures of the puma (top) and bobcat (bottom) are shown. In b, alpha-helices and beta-sheets are shown in green and pale blue, respectively. In the right panels of a and b, Zn2+ is represented as a gray sphere. In c and d, the three amino acids that differed between the puma and the other felids shown in a (bobcat, cheetah and lynx; residues 90, 131 and 178) are represented in orange or red
