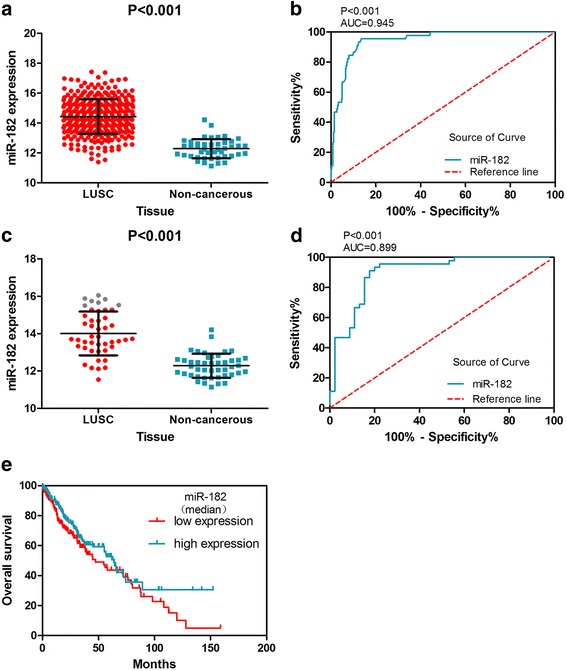
Fig. 1.

MiR-182 expression is increased in TCGA LUSC samples and has diagnostic value. a The expression of miR-182 in 338 LUSC and 45 non-cancerous lung tissues. b The ROC curve was generated to assess the diagnostic ability of miR-182 in 338 LUSC and 45 non-cancerous lung tissues. The AUC was 0.945 (95% CI 0.9167 to 0.9728, p < 0.001). The sensitivity was 86.39%, and the specificity was 95.56%. c MiR-182 expression in LUSC and adjacent normal tissues from 45 LUSC patients. d The ROC curve was generated to assess the diagnostic ability of miR-182 in LUSC and adjacent normal tissues from 45 LUSC patients. The AUC was 0.899 (95% CI 0.8329 to 0.9656, p < 0.001). The sensitivity was 80.00%, and the specificity was 93.33%. e Assessing the prognosis of TCGA LUSC patients using the Kaplan-Meier curve
