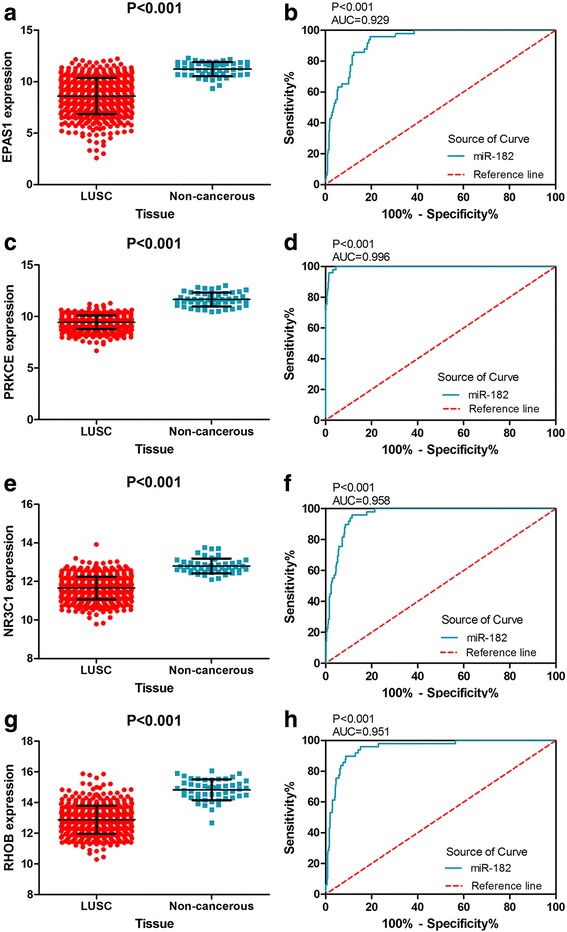
Fig. 11.

The expression of four hub genes was decreased in TCGA LUSC samples and ROC curve analysis. a The expression of EPAS1 in 502 LUSC and 49 non-cancerous lung tissues. b ROC curve was generated to assess the diagnostic ability of EPAS1 in 502 LUSC and 49 non-cancerous lung tissues. The AUC was 0.929 (95% CI 0.9023 to 0.9558, p < 0.001). c The expression of PRKCE in 502 LUSC and 49 non-cancerous lung tissues. d The ROC curve was generated to assess the diagnostic ability of PRKCE in 502 LUSC and 49 non-cancerous lung tissues. The AUC was 0.996 (95% CI 0.9929 to 0.9995, p < 0.001). e The expression of NR3C1 in 502 LUSC and 49 non-cancerous lung tissues. f The ROC curve was generated to assess the diagnostic ability of NR3C1 in 502 LUSC and 49 non-cancerous lung tissues. The AUC was 0.958 (95% CI 0.9404 to 0.9749, p < 0.001). g The expression of RHOB in 502 LUSC and 49 non-cancerous lung tissues. h The ROC curve was generated to assess the diagnostic ability of RHOB in 502 LUSC and 49 non-cancerous lung tissues. The AUC was 0.929 (95% CI 0.9238 to 0.9774, p < 0.001)
