
Fig. 5.
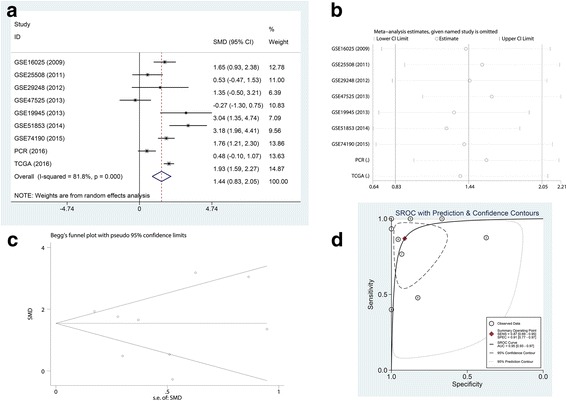
Meta-analysis of PCR, TCGA database, and GEO microarrays. a Forest plot of miR-182-5p expression data from PCR, TCGA database, and GEO microarrays. The pooled SMD of miR-182-5p was 1.44 (95% CI 0.83 to 2.05) by the random effects model. The I-squared value was 81.8%, and the p value was less than 0.001. b Sensitivity analysis of PCR, TCGA database, and GEO microarrays. c The funnel plot shows the publication bias of PCR, TCGA database, and GEO microarrays (Begg’s method). d sROC curve (AUC) of miR-182-5p in the diagnosis of LUSC data from PCR, TCGA database, and GEO microarrays. The AUC was 0.95 (95% CI 0.93–0.97)