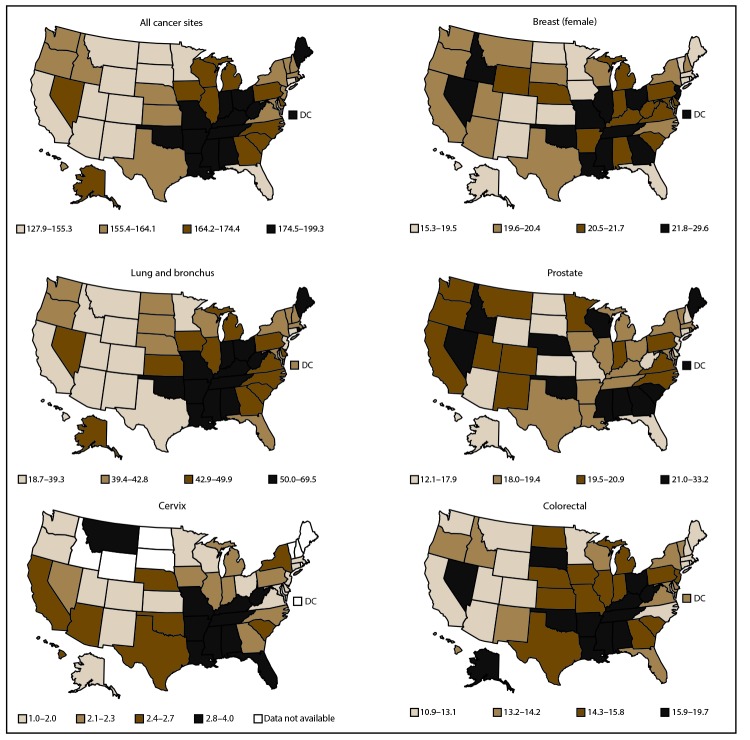
FIGURE 4.
Age-adjusted rate* of cancer deaths, by primary cancer site and state — United States, 2013†
* Rates are the number of deaths per 100,000 persons and are age-adjusted to the 2000 U.S. standard population (19 age groups – Census P25–1130). Rates are presented by quartiles. For more information, see USCS technical notes (https://www.cdc.gov/cancer/npcr/uscs/pdf/uscs-2013-technical-notes.pdf#nameddest=RegistriesPubCriteria).
† Data are from the National Vital Statistics System (NVSS). Data for death rates cover 100% of the U.S. population. Caution should be used when comparing incidence and death rates because of potential differences in population coverage.

