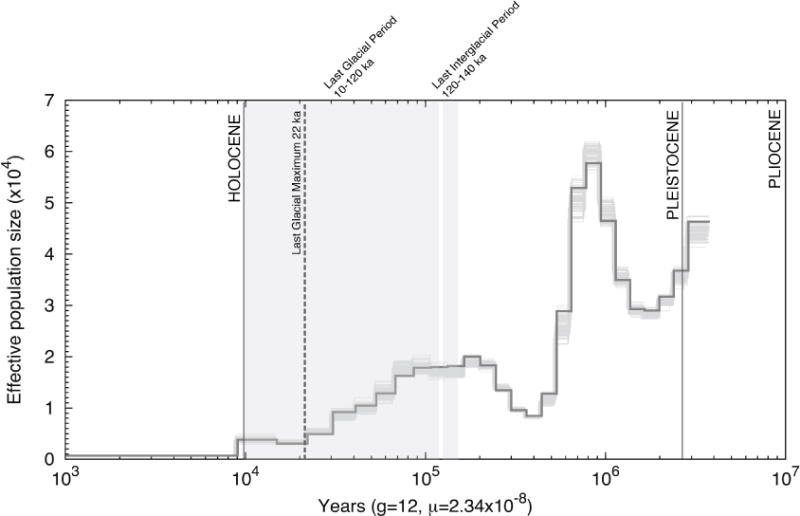
Figure 1. Demographic history of the Sumatran Rhinoceros.

The PSMC analysis is applied to the genomic sequences of the Sumatran Rhinoceros converted to demographic units (individuals and years) assuming a generation time of g = 12 years and a substitution rate of μ = 1.95 × 10⁻⁹ substitutions/site/year (2.34 × 10⁻⁸ substitutions/site/generation). The x-axis indicates time before present in years on a log scale and the y-axis indicates effective population size. The bold grey curve shows the estimate based on original data, and the light grey curves show the estimates for 100 bootstrapped sequences. The two gray shaded areas indicate the last glacial period (LGP) and the last interglacial period (LIG) and the dashed line demarcates the approximate time of the last glacial maximum (LGM, see also Figure S1).
