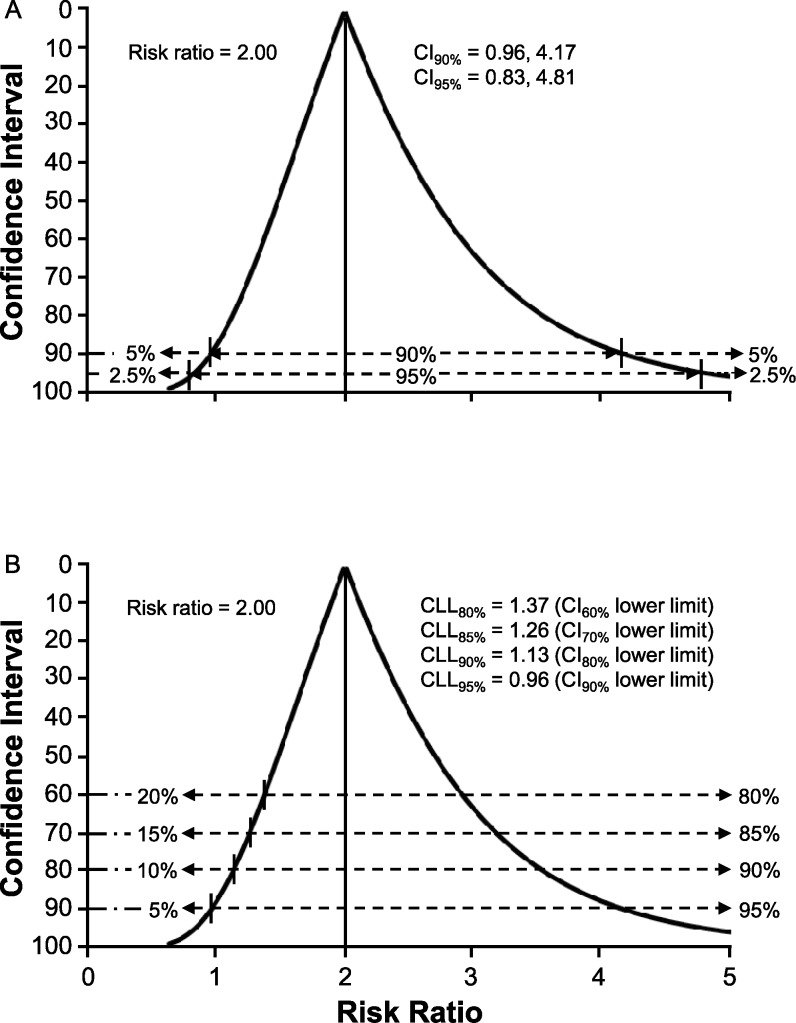
Figure 2. .
Confidence interval (CI) function for the risk ratio in a cohort of 40 individuals equally distributed between high-risk and low-risk classifications, 37.5% criterion-positive outcome, and diagnostic/prognostic test sensitivity of 67% and specificity of 60%. A, Two-sided probabilities for values outside the lower limits and upper limits of 90% CI and 95% CI. B, Credible lower limit (CLL) values and 1-sided probabilities for risk ratio values below the lower limit for CI levels of 60%, 70%, 80%, and 90%.

