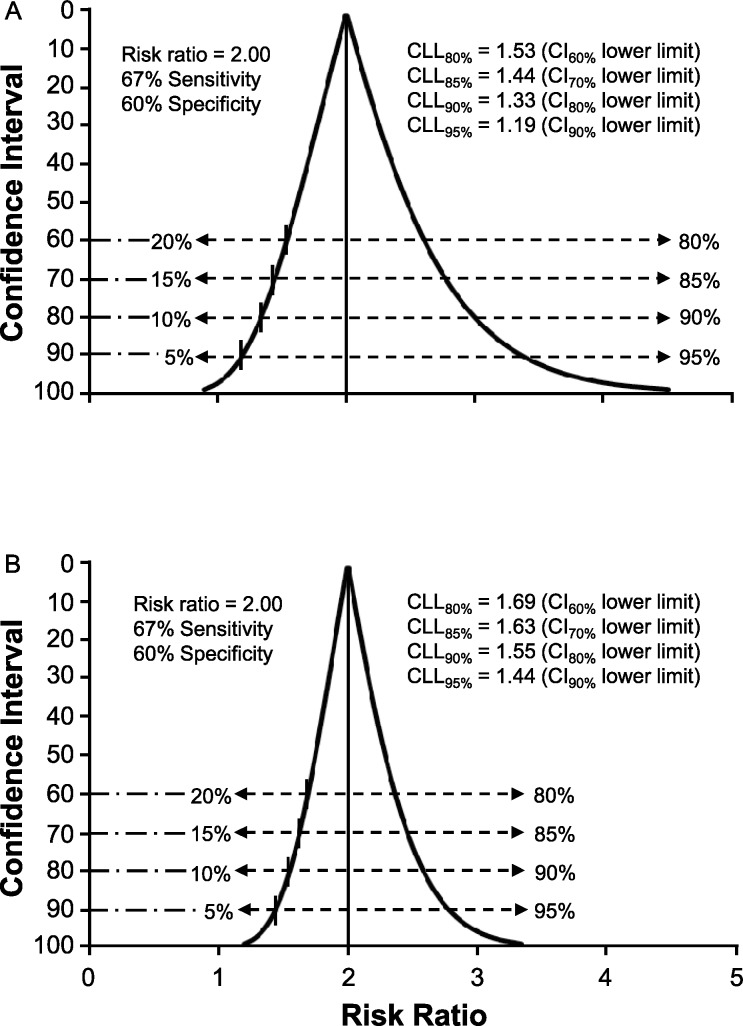
Figure 3. .
Confidence interval function for risk ratio with a focus on the proximity of the credible lower limit (CLL) values to the null value of 1.0 (ie, no association). A, Influence of an increase in cohort size to 80 individuals on the precision of estimates. B, Influence of an increase in cohort size to 200 individuals on the precision of estimates.

