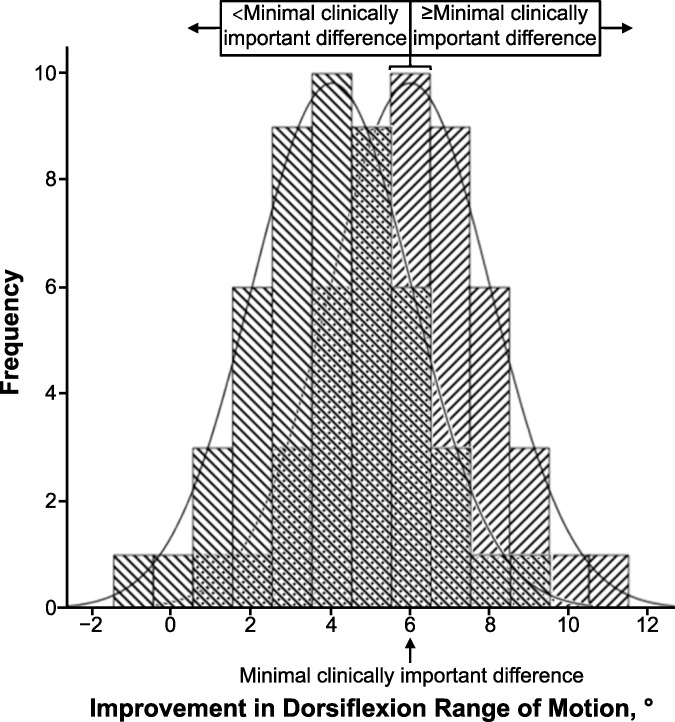
Figure 6. .
Overlapping distributions corresponding to those depicted for treatment A and treatment B1 in Figure 4. Each histogram bar represents the number of cases observed to achieve a given amount of ankle-dorsiflexion improvement. The probability for a patient to achieve or exceed minimal clinically important difference (ie, 6° of improvement) corresponds to the proportion of such cases within a group (ie, 11/50 = 0.22 for treatment A and 30/50 = 0.60 for treatment B1).

