Figure 3.

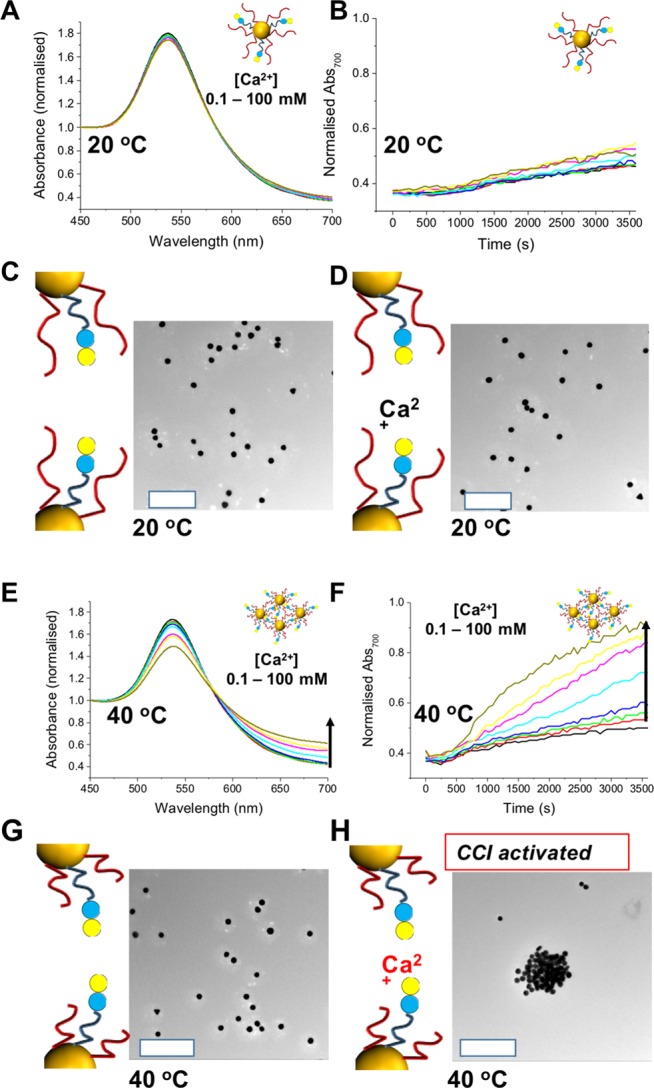
Temperature-controlled gating of lactose expression at a Lac-pHEA15:pNIPAM50 ratio of 9:1 @Au60 surfaces. Ca2+ addition at 20 °C at (A) full UV–vis and (B) time dependence. TEM analysis (C) without and (D) with calcium showing no aggregation. Ca2+ addition at 40 °C at (E) full UV–vis and (F) time dependence. TEM analysis (G) without and (H) with calcium showing selective CCI activation. Scale bar = 500 nm.
