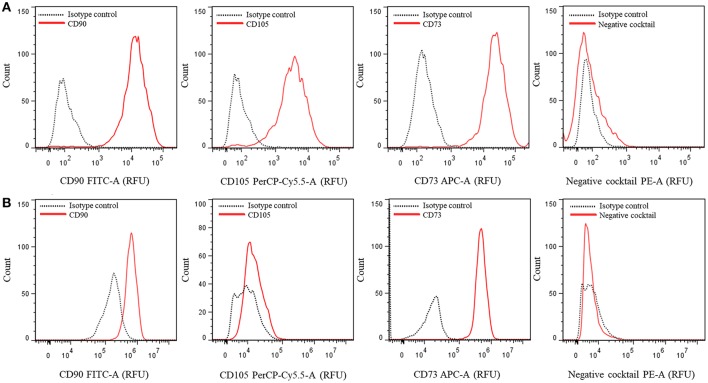
Figure 2.
Multicolor phenotyping of hASCs by flow citometry. Histograms represent the number of events (count) vs. the relative fluorescence units (FRU) for each indicated fluorophore conjugated-antibody or cocktail. (A) Representative graphs of a population with most of the cells positive for CD90, CD105, and CD73. (B) Representative graphs of a different population of cells which did not express CD105.

