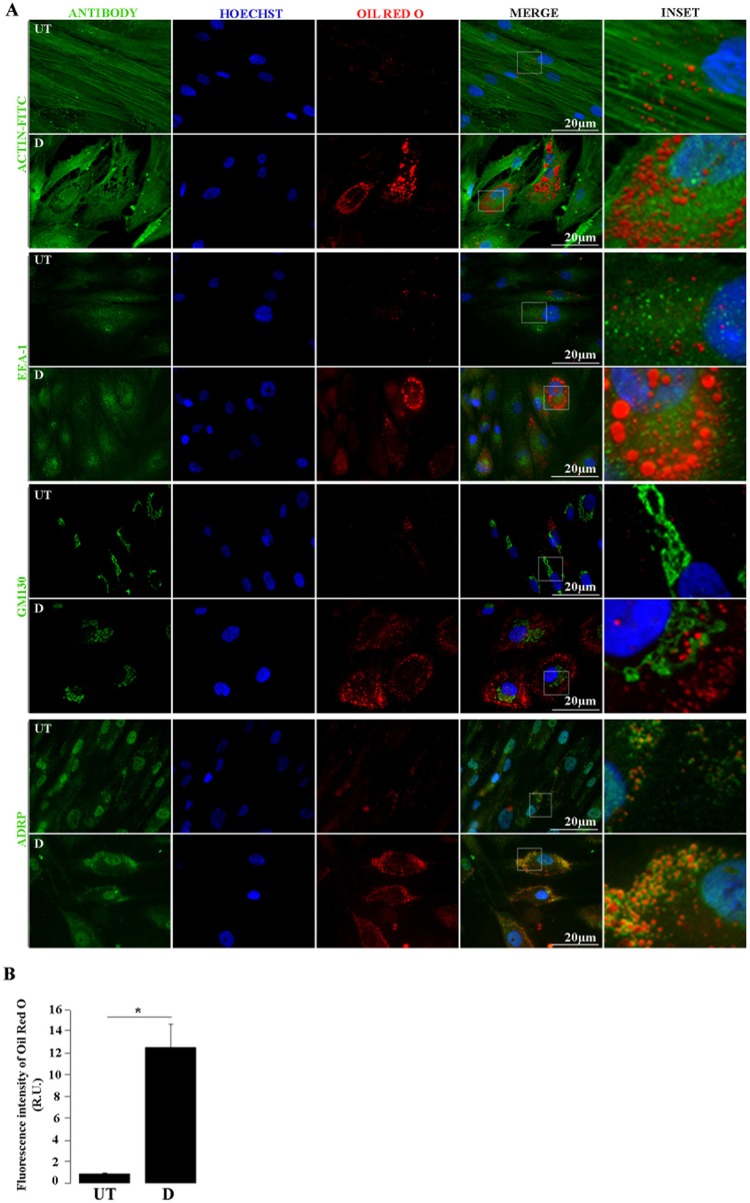
Figure 4.
Lipid droplets and cellular proteins double staining. (A) by Untreated (UT) and differentiated (D) hASCs were Oil Red O (ORO) and immunostained, and analyzed by fluorescence microscopy. Green signal corresponds to the indicated proteins detected by immunofluorescence (Actin-FITC) or indirect immunofluorescence (EEA-1, GM 130, ADRP); blue signal corresponds to Hoechst-stained nuclei; red signal corresponds to ORO-stained LDs. (B) Automated quantification of ORO fluorescence intensity relative units (R.U.) in UT and D hASCs. Bars represent mean values (+/– standard deviation) from 14 ORO-stained images prepared as in A and normalized to the number of nuclei/image. The asterisk indicates significant differences between samples (Student's test; p-value < 0.01). Data were similar in two other experiments.

